The AI boom was bought with borrowed money. The money has been lost.
How the money was lost
The AI infra stocks these funds have been betting on crashed twice: in July, then again in October
Change in share price since 30 June 2026, per cent. Tap a line or a name to pick it out.
Loading prices …
{{ crash.selText }}
July: the crowd pulls back
Twenty AI-hardware stocks whose daily moves had a correlation of 0.45 over the previous year moved down together at 0.72. Situational Awareness lost two-thirds and sold its book to Citadel. Jane Street lost about $15bn.
October: fundamental repricing
Correlation falls back to 0.48. The second fall was a more fundamental repricing of the stocks themselves. The funds that survived July dumped again while the S&P 500 barely moved.
Source: Yahoo Finance daily closes to 16 October 2026. SK hynix in Seoul, Kioxia in Tokyo. Correlations: Who Is Dead on Paper v8, section 1.
At the average leverage equity hedge funds report to the SEC, are now dead or walking dead: each one has lost at least 40 per cent of its money. They can be forced by lenders to sell of stock.
Each underlined number opens its own data row.
The method, in three steps
All public filings. Dead simple.
1 · Collect the filings
Every US fund manager with more than $100mn in shares must report its holdings to the SEC each quarter, on Form 13F. hedge-fund managers filed for 30 June.
2 · Price them today, with no borrowing
Each fund's most recent filed holdings are priced as of 16 October market conditions. Even if no fund borrowed a cent, is dead, are walking dead and {{ b.wounded_1 }} are wounded.
3 · Add the average borrowing
No filings show any fund's leverage, so the SEC's own average for equity hedge funds is used: 2.7 times long, 1.9 times short. At that level funds are dead or walking dead.
Dead means a fund has lost all its money; walking dead, 40 per cent or more; wounded, 20 per cent or more. The leverage control in section 1 of The Unwind gives the count at any level from 1× to 4×.
Story 1 · First release
The Unwind
The funds have barely started selling to repay their lenders. The selling will spread to the largest stocks and to government bonds.
Story 2 · Coming next
The Physical Record
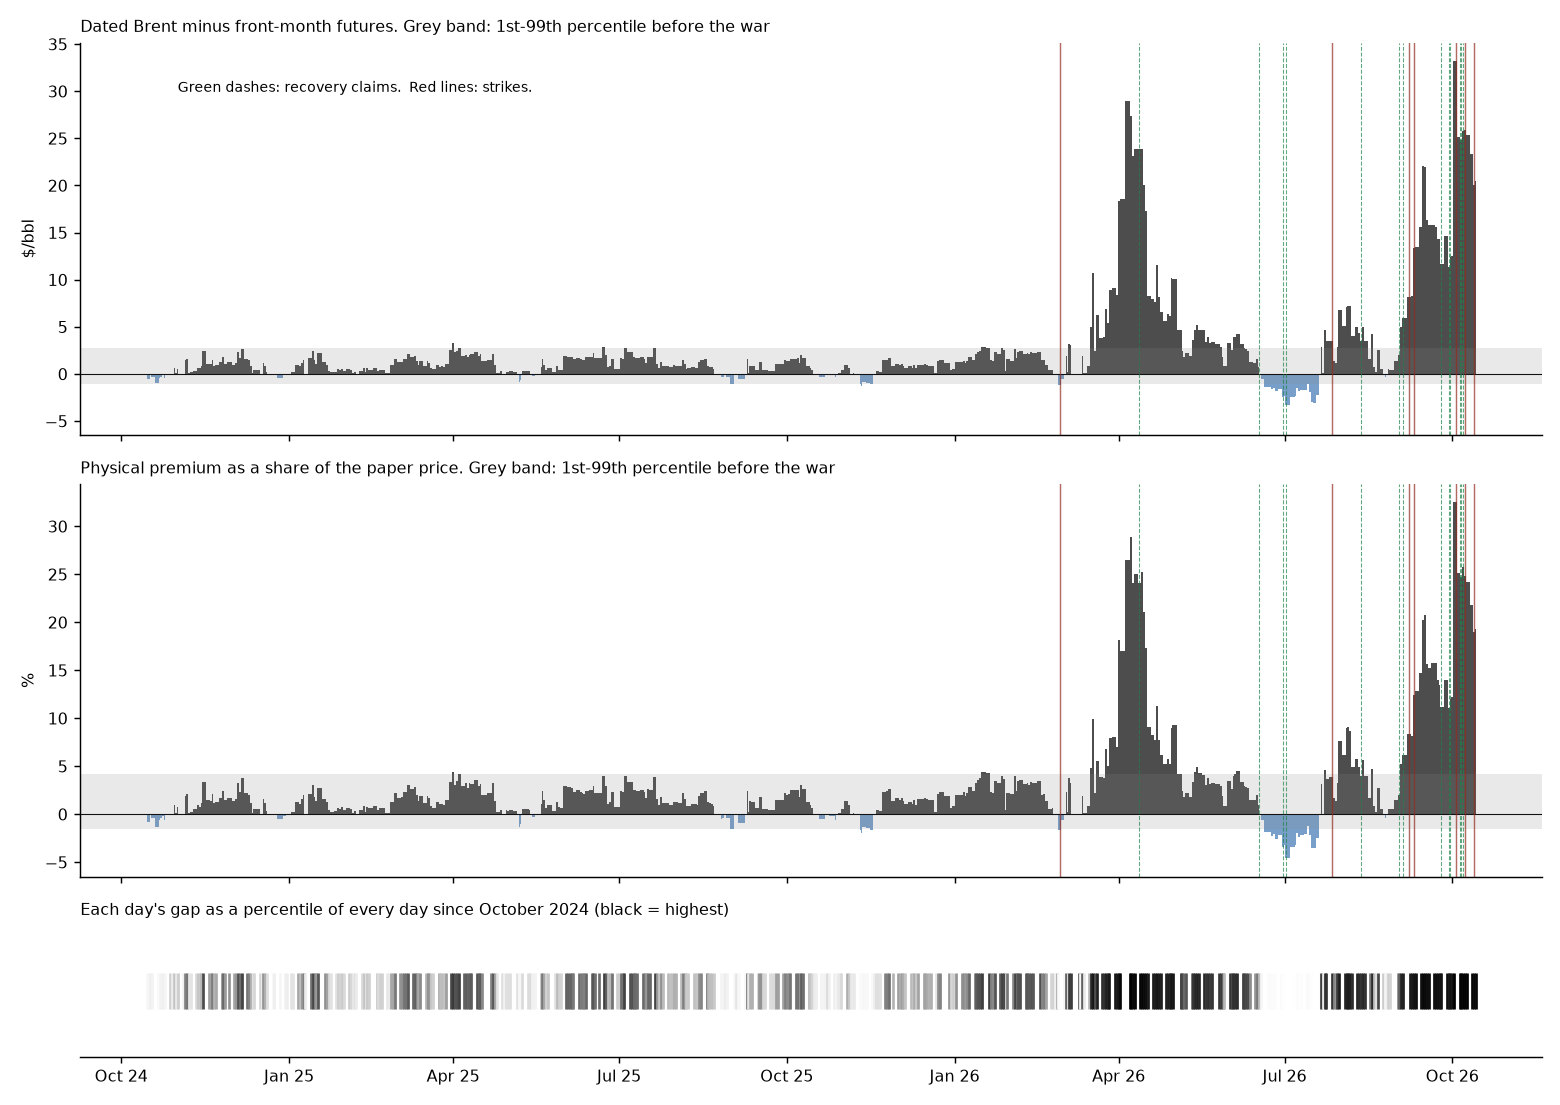
The oil crisis in satellite and futures data: the damage at each Gulf site, and the gap between paper and physical Brent.
Data room
See it for yourself
Step through the crash day by day. Set the leverage and watch funds cross the line. Find where the selling ends.
16 October 2026 · Day 229 of the Hormuz closure
The Unwind
Hedge funds borrowed to buy into the AI boom. Now on paper they have already lost huge sums of money. The selling to repay their lenders has barely begun.
How the money was lost
The AI infra stocks these funds have been betting on crashed twice: in July, then again in October
Change in share price since 30 June 2026, per cent. Tap a line or a name to pick it out.
Loading prices …
{{ crash.selText }}
July: the crowd pulls back
Twenty AI-hardware stocks whose daily moves had a correlation of 0.45 over the previous year moved down together at 0.72. Situational Awareness lost two-thirds and sold its book to Citadel. Jane Street lost about $15bn.
October: fundamental repricing
Correlation falls back to 0.48. The second fall was a more fundamental repricing of the stocks themselves. The funds that survived July dumped again while the S&P 500 barely moved.
Source: Yahoo Finance daily closes to 16 October 2026. SK hynix in Seoul, Kioxia in Tokyo. Correlations: Who Is Dead on Paper v8, section 1.
The method, in three steps
All public filings. Dead simple.
1 · Collect the filings
Every US fund manager with more than $100mn in shares must report its holdings to the SEC each quarter, on Form 13F. hedge-fund managers filed for 30 June.
2 · Price them today, with no borrowing
Each fund's most recent filed holdings are priced as of 16 October market conditions. Even if no fund borrowed a cent, is dead, are walking dead and {{ b.wounded_1 }} are wounded.
3 · Add the average borrowing
No filings show any fund's leverage, so the SEC's own average for equity hedge funds is used: 2.7 times long, 1.9 times short. At that level funds are dead or walking dead.
Dead means a fund has lost all its money; walking dead, 40 per cent or more; wounded, 20 per cent or more. The leverage control in section 1 of The Unwind gives the count at any level from 1× to 4×.
In brief
A small number of hedge funds financed the AI boom with money borrowed from a small number of banks. That money has already been lost.
At the average leverage that equity hedge funds report to the SEC, of them are dead or walking dead.
To bring their borrowing back to the level their lenders allowed in June, the funds must sell of stock. That is more than LTCM's whole balance sheet when it failed.
This is the largest forced sale of borrowed equity on record, and it has only just begun.
1. The money has already been lost
The losses have already happened. The prices of 16 October show them.
The 30 June 13F filings of hedge-fund managers, priced at 16 October, show the damage. Taking the holdings as filed, with no borrowing, fund is dead and are walking dead.
A typical equity hedge fund holds positions 4.6 times the size of its capital, 2.7 times long and 1.9 times short, according to the SEC's Form PF statistics. At that leverage, funds are dead, are walking dead and more are wounded.
Goldman Sachs says hedge-fund leverage rose more in the first half of 2026 than in any period since its records began in 2016. The true counts are probably higher.
No filing discloses a fund's leverage. The count below changes with the leverage chosen.
{{ b.Lfmt }}×
Dead: has lost all its money or more. Walking dead: has lost 40 per cent or more. Wounded: 20 per cent or more. Short positions are set at 0.72 times the long side and assumed to have moved with the S&P 500 since 30 June. Leverage is applied to the 517 managers whose 13F book is their main book; the rest keep the score on their filings. That is why 1× here differs from the count on holdings as filed.
The funds hit hardest are among the best known in the trade.
Fund
13F book, 30 June
Loss at 2.68×
At {{ b.Lfmt }}×
{{ f.name }}
${{ f.book }} bn
{{ f.live }}
Situational Awareness, the best-known fund in the trade, grew from $250mn to a gross book of $45bn in 18 months, borrowing four times its money. It collapsed in three weeks in July.
2. The funds must sell, and they will sell what still has buyers
Losses raise a fund's leverage. Its lenders then make it sell until leverage is back where it was.
A fund at 2.7 times leverage that loses $1 must sell $1.70 of stock to return to 2.7 times. Across all the funds with losses, the total is .
The stocks that have already fallen cannot absorb the selling.
Dycom, MasTec, Quanta Services and Core Scientific build and run data centres. The funds must sell Dycom shares equal to of all Dycom shares traded in the past two weeks. For MasTec the figure is 43 per cent, for Quanta Services 37 per cent and for Core Scientific 32 per cent. In these four stocks, the funds' forced sales now set the price.
So the funds sell the shares that can still be sold, including the largest in the market.
VARA alone held call options on $4.66bn of Alphabet, $4.35bn of Amazon and $4.04bn of Nvidia. Nvidia peaked on 6 October and has since fallen 10.5 per cent.
3. The lenders are all in the same boat
Four banks lend to the failing funds: Morgan Stanley, Goldman Sachs, Bank of America and JPMorgan. They lend to the rest of the market too.
Each fund lists its prime brokers in its Form ADV filing. Morgan Stanley is prime broker to 23 of the funds that are wounded or worse, and Goldman to 22.
The same banks lend to Jane Street, Wall Street's largest trading firm, which lost about $15bn in July, its first losing month since 2016. JPMorgan cut its lending to Jane Street in early September.
4. The money that built the data centres is now losing
Part of the demand for AI computing was paid for with profits from trading AI stocks. Those profits are now losses.
During its record first half, Jane Street signed about $19bn of contracts for AI computing, $6bn of it with CoreWeave and about $13bn with Crusoe. CoreWeave's shares have fallen 38 per cent since June.
5. Nothing is in place to stop it
The concurrent oil shock rules out the rescue that ended each recent financial panic.
If the Federal Reserve cut rates or bought bonds now, it would do so while oil and freight prices are rising. The firms that are buying intend to resell quickly at a profit. That's not market support.
6. Where this stands in history
Each of these shocks has happened before, but never all at once.
{{ e.y }}
{{ e.what }}
7. What happens next, and when
The selling has barely begun. It runs from the smallest AI stocks to the largest, then into government bonds.
The rest we will see, on these dates:
Monday 19 October. The markets open.
Monday 16 November. Every fund's 13F for 30 September is due.
November. Investors give notice to leave their funds at 31 December.
Thursday 31 December. The withdrawals are paid.
{{ cur.num }}
{{ curTitle }}
{{ cur.sub }}
{{ b.Lfmt }}×
Loading avg_leverage_scores.csv …
At {{ b.Lfmt }}×, {{ lc.nWd }} of these {{ lc.n }} funds are walking dead or worse: their dot sits left of the red line.
Three exhibits, built from the same files as the stories. Move the date, the leverage or the stock, and the picture follows. Pick any fund to see the row it came from.
Exhibit 1
Step through the crash
Drag the date, or press play
{{ lab.dateLabel }}
Trading day {{ lab.dayN }} of {{ lab.dayTot }} since 30 June
Red ticks along the top mark the events below. The shaded area is the time already passed.
Change since 30 June, on {{ lab.dateLabel }}
{{ r.name }}{{ r.v }}
What happened around this date
{{ lab.evDate }}
{{ lab.evText }}
No marked event in the week before this date.
What to notice
In July the lines fall together, as if one seller were selling them all. In October they fall apart from each other, while the S&P 500 hardly moves.
Data: Yahoo Finance daily closes, 30 June to 16 October 2026 (Blowup Watch/price_cache_3y). Events: The Unwind v1 and Who Is Dead on Paper v8.
Exhibit 2
Set the leverage, and watch the funds cross the line
Drag the slider, then tap a dot
Leverage, long side
{{ b.Lfmt }}×
Dead
{{ b.dead_live }}
Walking dead
{{ b.wd_live }}
Wounded
{{ b.wounded_live }}
To sell
${{ b.sale_live }}bn
1×2×3×4×
{{ lab.fc.label }}
{{ lab.fc.name }}
{{ k.k }}
{{ k.v }}
{{ lab.fc.note }}
Tap a dot, search, or pick from the list. The card shows its numbers.
Hardest hit at {{ b.Lfmt }}×
What to notice: most funds sit near zero at any leverage. A narrow band of funds climbs fast as leverage rises, and they are the ones that bought the same AI-hardware stocks. Funds outside the equity group keep their score as filed and do not move.
Data: avg_leverage_scores.csv, one dot per manager, {{ b.rows }} rows.
Exhibit 3
Find where the selling lands
Tap a stock, or type a ticker
{{ lab.sc.label }}
{{ lab.sc.name }}
{{ k.k }}
{{ k.v }}
{{ lab.sc.note }}
Tap a dot, search, or pick from the list. The card shows its numbers.
Most days of trading to sell
What to notice: the largest sales, in Nvidia, Amazon and Alphabet, take about a day of trading or two. The data-centre builders, Dycom, MasTec and Quanta, take five days or more. That is where the selling sets the price.
Data: cascade_liq_stocks.csv, stocks with at least $10mn to sell.
Data archive
The data behind each chart
Everything on this site can be rebuilt from scratch. The original filings are public and free; the scripts that turn them into these datasets are published; and the steps are listed in order.
1. Datasets
The files the site reads, each built by a published script.
One row for each manager that filed a 13F for 30 June, with its book priced at 16 October and scored both on its filings and at the SEC's average leverage.
Rows
{{ b.rows }}
Sources
SEC 13F, 30 June 2026; SEC Private Funds Statistics 2025 Q3, Tables 8.14, 8.16, 8.17; Form ADV; Yahoo prices to 16 Oct, unchecked against Alpha Vantage